Nearly all digital cameras include histograms as part of the image review process. This little graph can tell you a lot about your photo, but only if you know how to read it. This guide will explain what histograms are, how to interpret them, and how to use them to improve your photography.
What is Histogram?
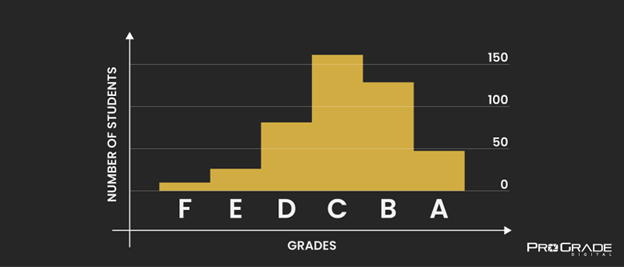
A histogram is a graphical representation of the distribution of numerical data. It was first introduced by Karl Pearson, an English mathematician. Histograms can represent practically anything, from the city’s demography to the income of different age groups. For example, the histogram below shows the distribution of student test scores.
A histogram on a digital camera is also a representation of the allocation of numerical data – light data. Put simply, a digital camera’s histogram represents the brightness values of all the pixels in a photograph. It can be used to determine whether an image is properly exposed or not.
How to Read a Digital Camera’s Histogram?
The horizontal axis of the digital camera’s histogram represents the brightness value of each pixel. It goes from pure black (0% brightness) on the left to pure white (100% brightness) on the right. The vertical axis shows the number of pixels at each brightness value. So, the taller the peak, the more pixels there are in that brightness value.
The illustration below shows the typical histograms of under-exposed, over-exposed, and properly exposed photos.
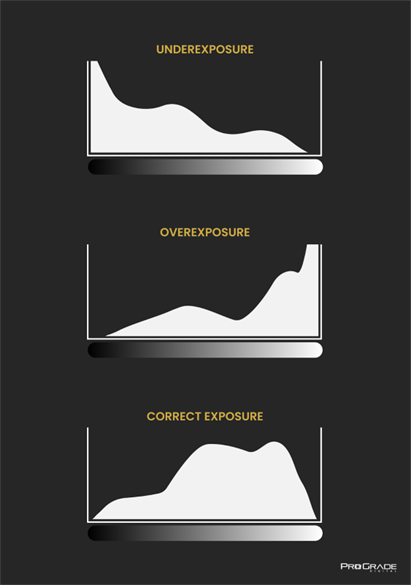
Many beginners wrongfully assume that a histogram bumping against the ceiling of the graph indicates a specific part of an image that is overexposed (a condition known as “blown out highlights”) and the histogram touching the floor of the graph an area of an image that is under-exposed (a condition known as “blocked shadows”). But that’s not how you read histograms. That’s how you read waveform scopes, like the Luma waveform.
Instead, it’s the sides that matter. A histogram that touches the left side of the graph indicates that some pixels are severely under-exposed, and a histogram that touches the right side shows that some pixels are over-exposed. But it won’t tell you which pixels exactly.
The height of the histogram is completely unimportant unless on either side of the graph. Don’t be concerned about the spikes, also. Even if the peaks touch the top of the vertical axis, it’s absolutely okay.
How to Use Your Camera’s Histogram?
The histogram helps you avoid “clipping”. If parts of the image are either “blown out” or “blocked”. they will appear as pure white or pure black on the photo. In most cases, this is undesirable because all the details in those areas are lost.
Important: There is no such thing as a perfectly spread and shaped histogram for all the photos. Instead, every photo will have its own ideal histogram. One that is unique to that particular scene. As the tonality of the scene will vary, so will the histogram showing that data.
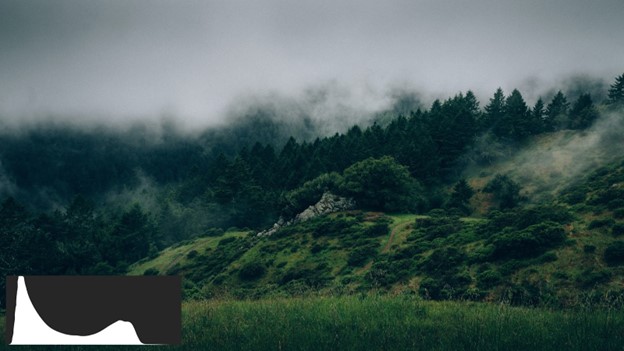
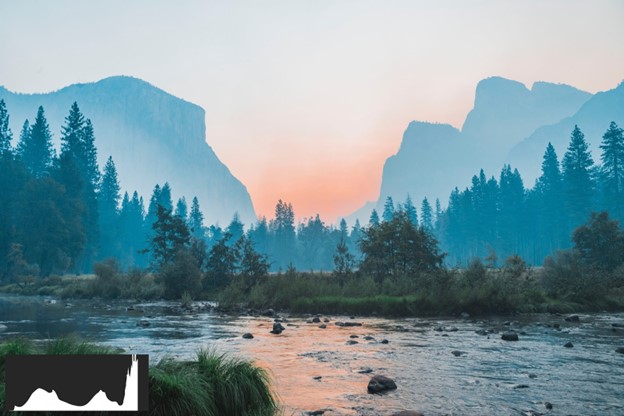
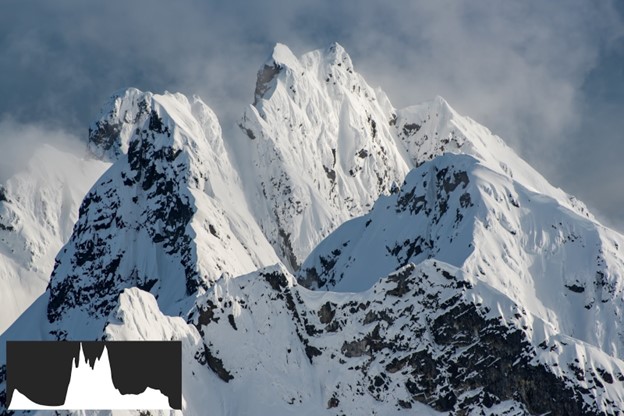
For example, all three following images are perfectly exposed, yet their histograms are entirely different.
So don’t get concerned if you don’t always see a perfect bell-shaped curve or if you sometimes see lots of spikes and gaps in your histogram.
Instead, check the histogram for abnormalities and make adjustments only if you see something to be off for that particular scene.
It’s okay for the histogram to be skewed to the left when you shoot stars in the night sky but not when shooting snowcapped mountains. It’s even okay to see a “U” shaped histogram when shooting a high-contrast scene.
Left-Skewed Histogram
A left-skewed histogram may indicate underexposure. It means the shot is full of dark pixels. Again, it might be okay if you’re aiming for a dark, dramatic image characterized by striking contrasts and shadows, but if not, you can fix it by letting in more light. Lower the shutter speed, widen the aperture, or raise your camera’s ISO.
Keep in mind, each of these adjustments will affect the image quality. Increasing ISO can introduce noise. Lowering the shutter speed might introduce a camera shake. And widening the aperture might produce a shallower depth of field, something you may not desire for a particular scene. It’s often wise to slightly adjust all three rather than one overly.
Right-Skewed Histogram
A right-skewed histogram may indicate overexposure. It means the highlights are washed out, and the shot is full of light pixels. If you don’t go for a high-key image, narrow the aperture, shorten the exposure, or lower the ISO. That helps reduce the light reaching your camera’s sensor.
A quick way to decrease (as well as increase) the exposure is using your camera’s exposure compensation dial. This allows you to adjust the brightness in small increments.
Tightly Clumped-Up Histogram
A tightly clumped-up histogram with a lot of space on either side may indicate low contrast. It means all the tones are crumpled into one narrow range. If that is not what you want, try adding light to your scene. If that’s not possible, perhaps you can reframe the shot to deepen shadows and intensify highlights. If that, too, is not possible, there’s always post-processing.
As long as there’s no clipping and all of the information in shadows and highlights is retained, you can fix any contrast issues in the post. Just shoot in an uncompressed, raw format. RAW files give you more information to work with and are much more forgiving when it comes to fixing contrast issues or severely underexposed or overexposed images.
Best Memory Cards for Shooting RAW Files
RAW files are much larger than their JPEG counterparts and require memory cards that have a larger capacity and can sustain a higher data write rate. ProGrade Digital memory cards are designed with RAW files in mind. So you can be sure that all the information your camera captures will be retained. Even when bursting RAW photos.